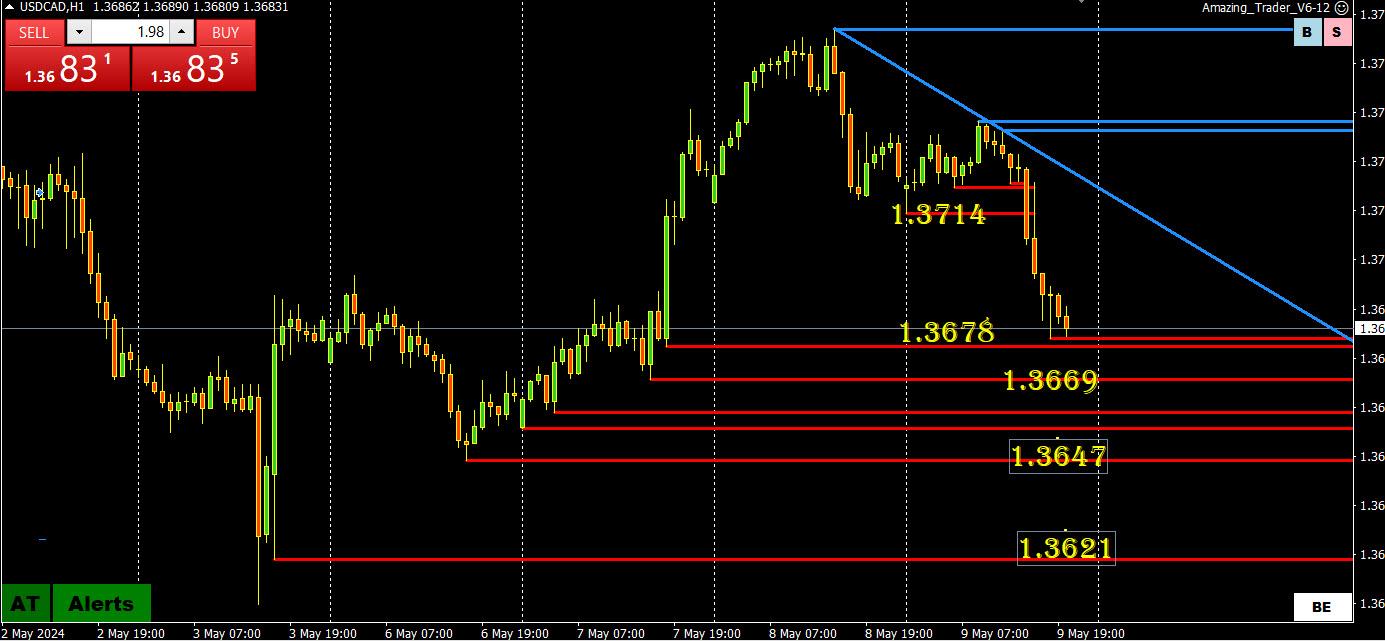
Sometimes the CAD is referred to as the Loonie and for good reason but not this time USDCAD was trading soft even when the USD moved higher earlier today. So it should be no surprise to see it trade down when the USD turned soft.
As this chart shows, there are layers of support between 1.3620-80 that needs to break for the move down to pick up steam.
Look for a limited upside if it stays below 1.3713.
Note the key Canadian jobs report is released on Friday.
All Treasuries have flatlined in the sell cycle. 20yr has to eclipse and hold 91.70 to support Eur appreciation. Eur-Aud-Gbp all bid overall albeit lacking drive at the moment.
Vix futures have been sideways for 12 hours with a slight undertow in volume (short side). Dow covered calls fell off of a cliff around at session end yesterday, since there was zero impetus the odds were stacked that stocks would catch a bid today. That said there is already an increase in underlying puts to a slight extent which could assist in putting a cap in the gains. I like your 106 DXY notation earlier Jay. Result with consideration to many other things could end up being some bit of a continuation in risk appetite only to be followed by an offered scenario in risk coming up I think. Hence why I am already scaling in the long side of USD from below.
EURUSD minor 4-hour down trendline at 1.0764 has been broken. One look at EURGBP will tell you where some of the demand is coming from. although the USD is softer in general despite a bounce back in bond yields. (4.502%)
I think its unlikely the sell cycle in Dow runs out of steam overall until tomorrow and then the risk turns toward a bid bias. Time will tell. If so then 3880 would hold.
Reaction to the weekly jobless claims shows the state of the market and how sensitive it is toi even 2nd or 3rd-tier data. US yields have ticked back up, looks like a Power of 50 in 10-year yields at 4.50% (last 4.4943% vs. 4.477% low post data)
Looking at this chart, technicals are still pointed up but the range is .8581-.8619, with .8600 as the midpoint.
For me this suggests using .8600 as a barometer of GBP strength (relative term) or weakness.
On the upside, a firm break above .8620 would put the major,8744 level in play.
On the downside, a firm break of .8580 would suggest the high is in for now and cooling pressure on GBPUSD.
Break off 1.2466 has so far been unable to reach 1.2422-40. The significance of these levels is below it would open the floodgates on the downside (major support is at 1.2298).
Otherwise, there are two pivotal levels
1.2500-05 on top
and
1.2450 (Power of 50 level) for intra-day trading bias (currently back above it)
As I noted, also loom at EURGBP as an indicator of GBP weakness or noit.
Author
Posts
Viewing 20 posts - 2,181 through 2,200 (of 5,083 total)